Complex ranking data
Make employee data, a one-to-five ranking model, and the target talent curve understandable within a tight timeline.

02 / Morgan Stanley · Talent management
Turning complex employee ranking into a clearer, more visual experience for managers.
01 / About the Project
Connect individual employee rankings with a clear view of the whole team.
Make employee data, a one-to-five ranking model, and the target talent curve understandable within a tight timeline.
Help managers enter employee rankings, compare team distributions, and review peers through connected list and visual views.
Testing and stakeholder interviews indicated faster submission tasks and positive feedback on visual ranking. Familiar direct entry remained available.
02 / User research
Rank employees, compare team results, and switch between list and visual views.
Keep employee lists, filters, and ranking status easy to scan.
Let managers enter ranks and compare results in list and visual views.
Use prototypes, user testing, and technical reviews to refine the design.
03 / UX & Visual Design
The design connected employee rankings with team-level distribution and comparison views.
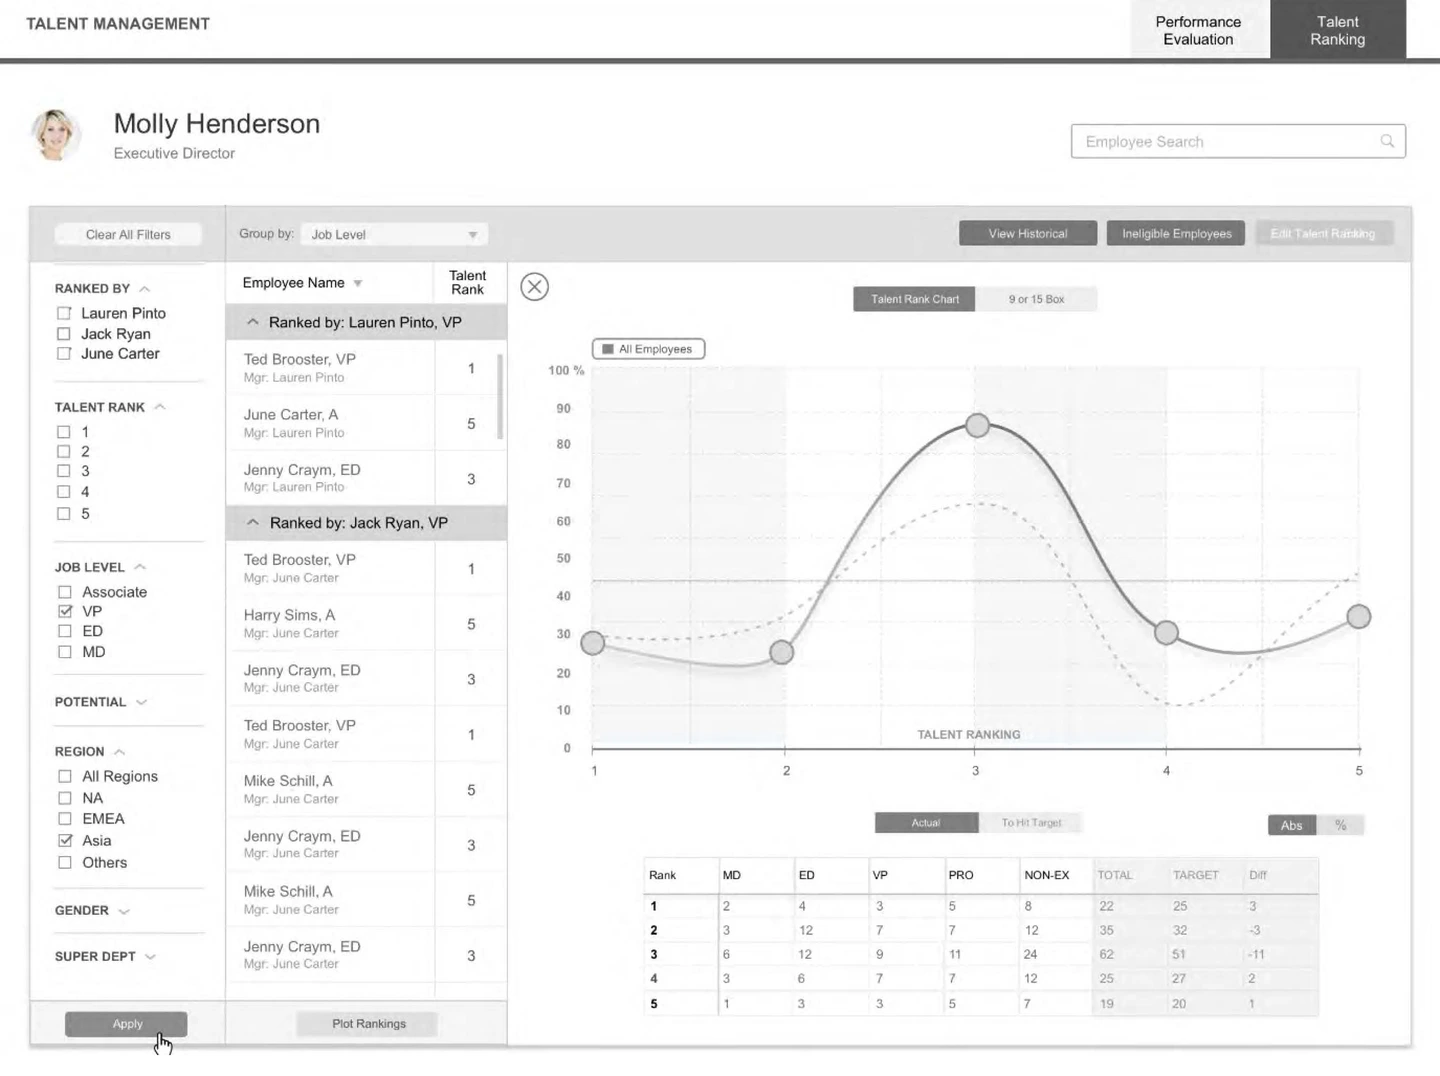
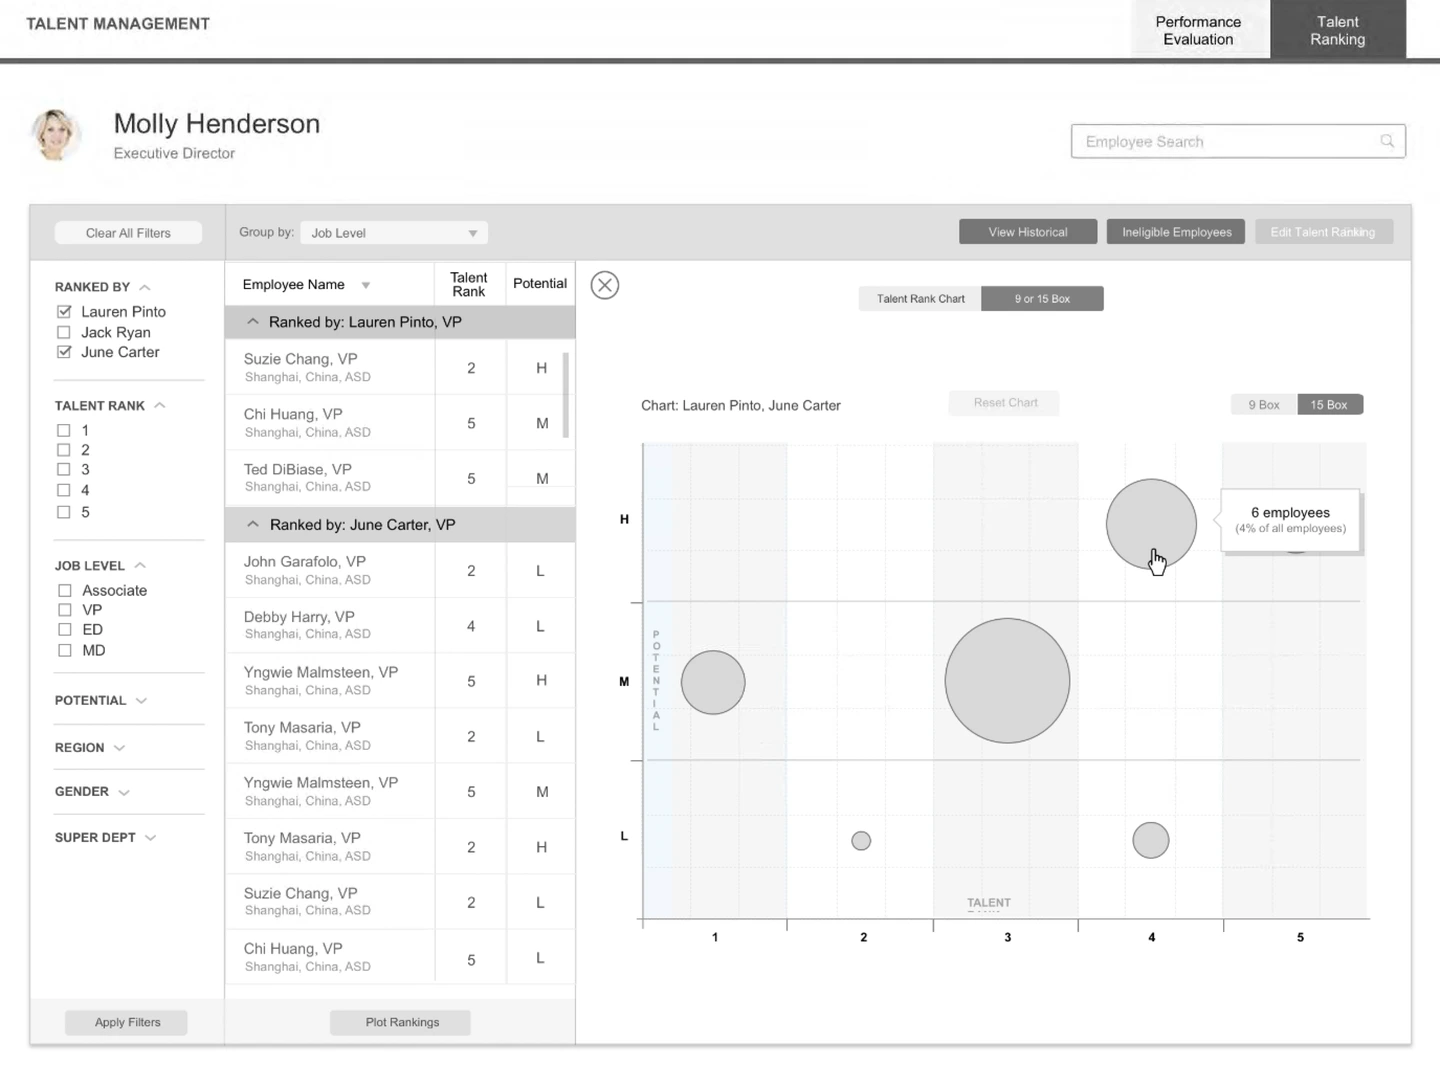
Early sketches tested how employee lists, ranking curves, and comparison views could connect individual ratings with the overall team distribution.
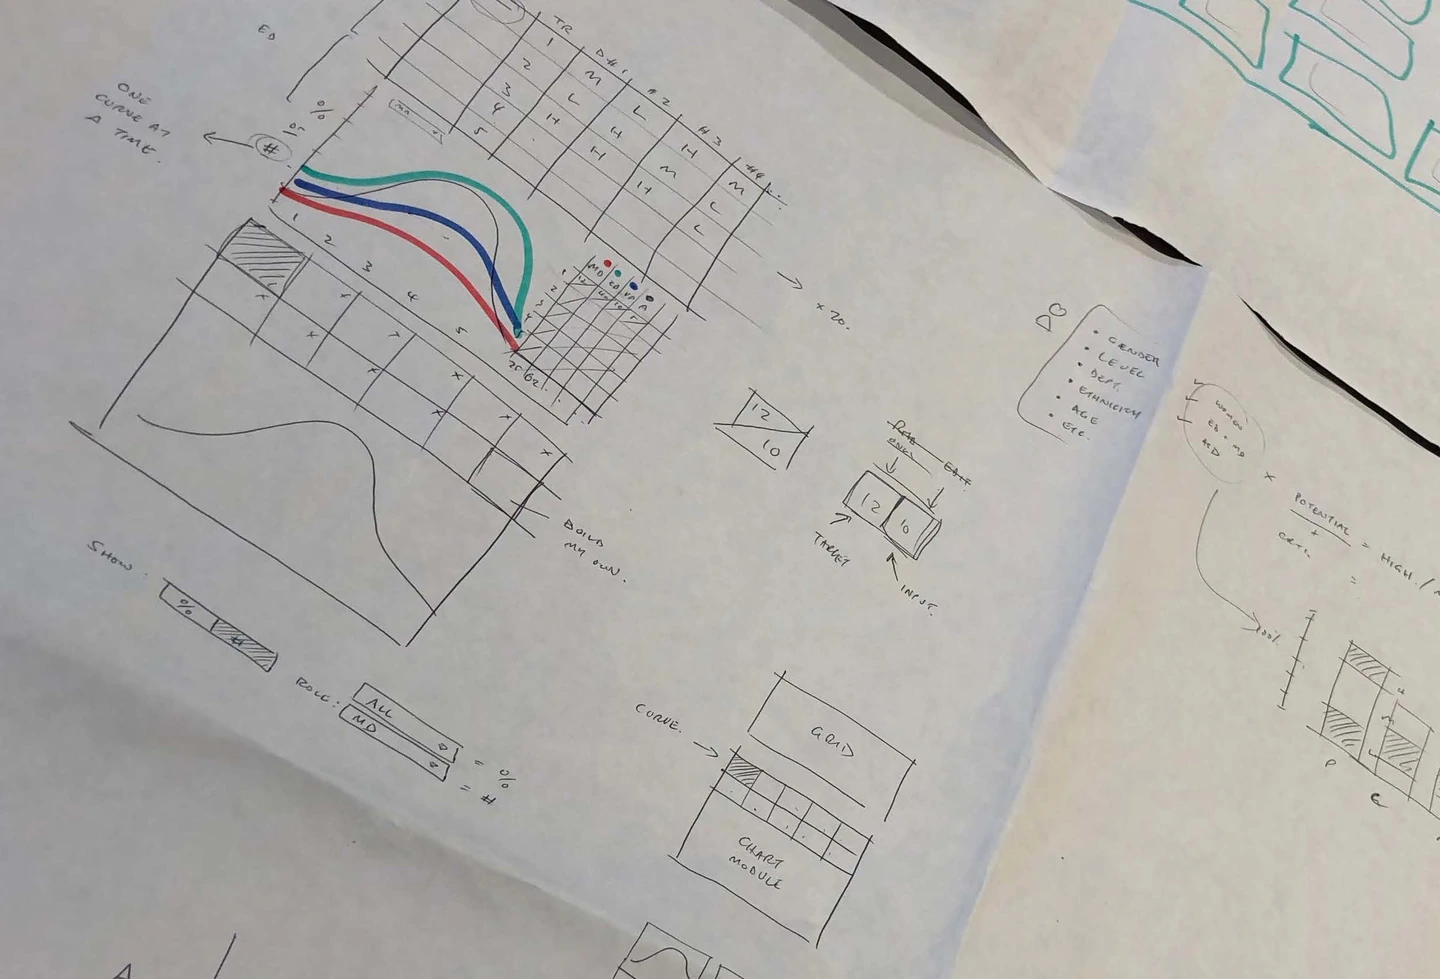
Early sketches from the project, before the interface was refined.
Stakeholder interviews, prototypes, usability testing, and technical reviews guided the designs from requirements through development.

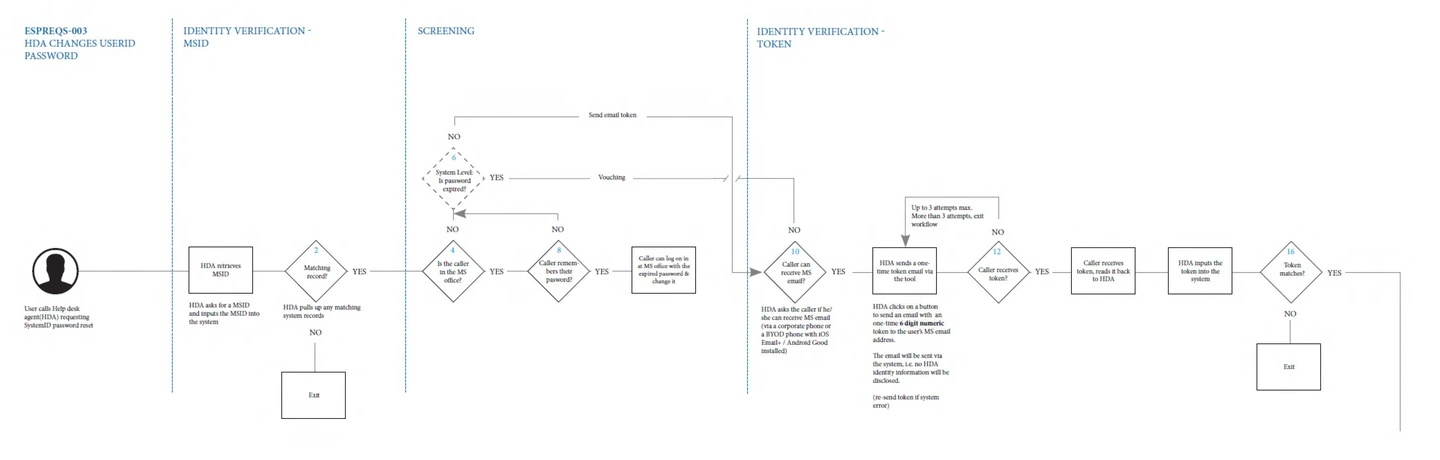
This related-project flow shows how I document decision points, alternate paths, and system dependencies before designing detailed screens.
Wireframes connected employee lists, filters, and ranking states to the talent curve. Prototypes tested the transition from entering ranks to reviewing the distribution.
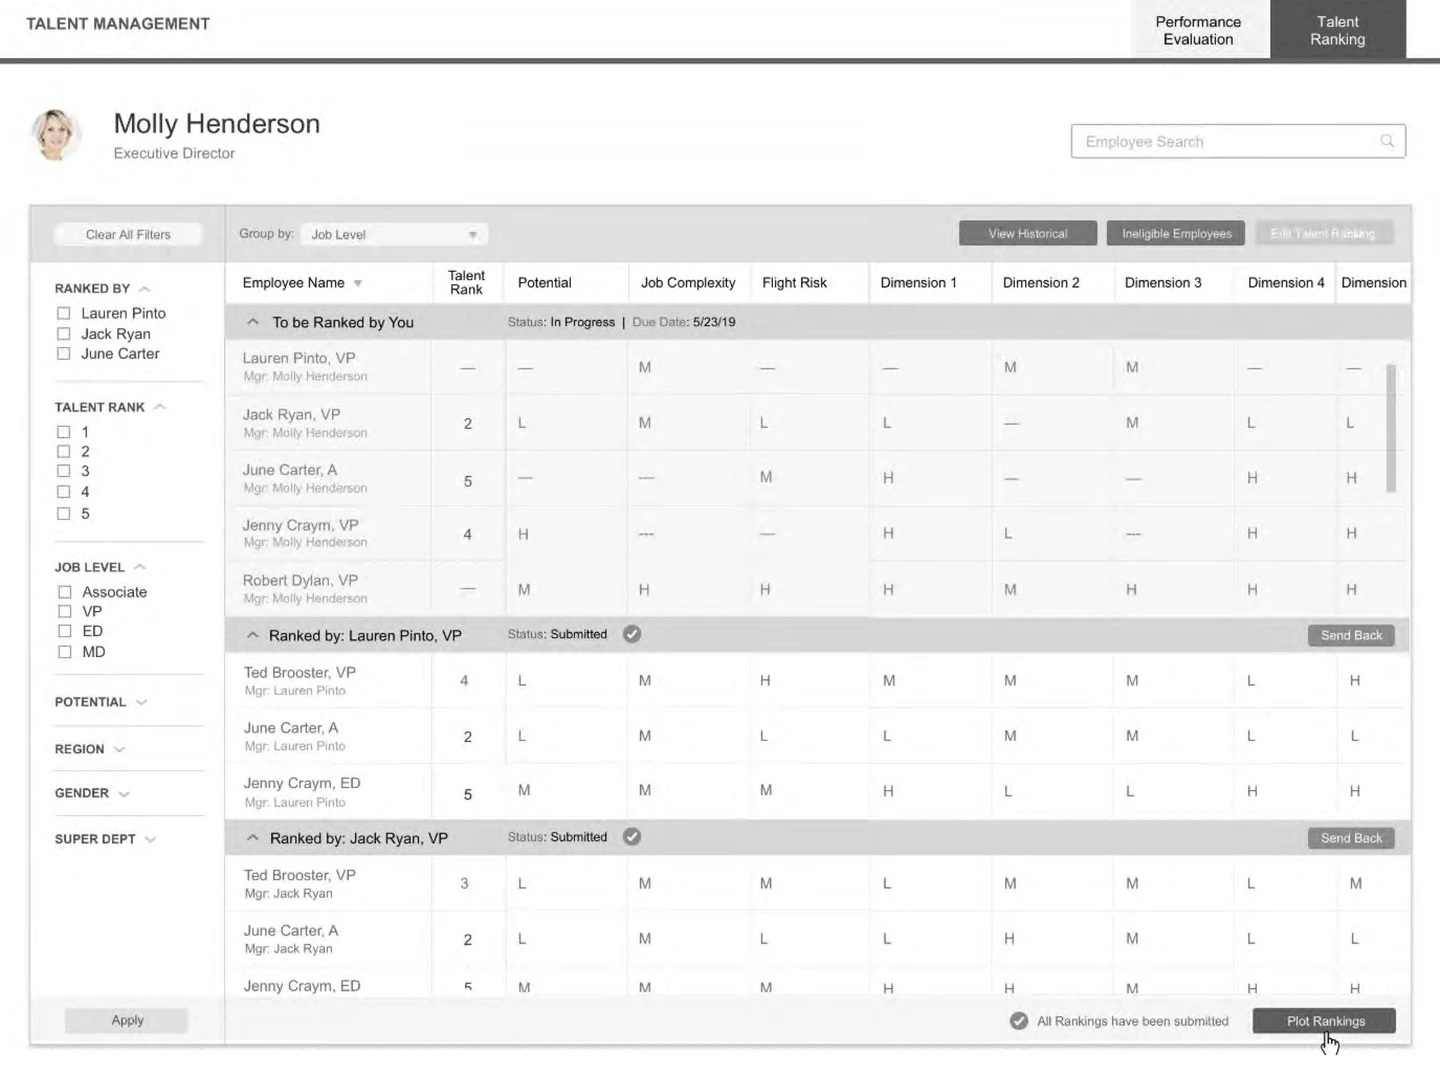
Original lower-fidelity wireframes used for prototyping, followed by the color designs below.
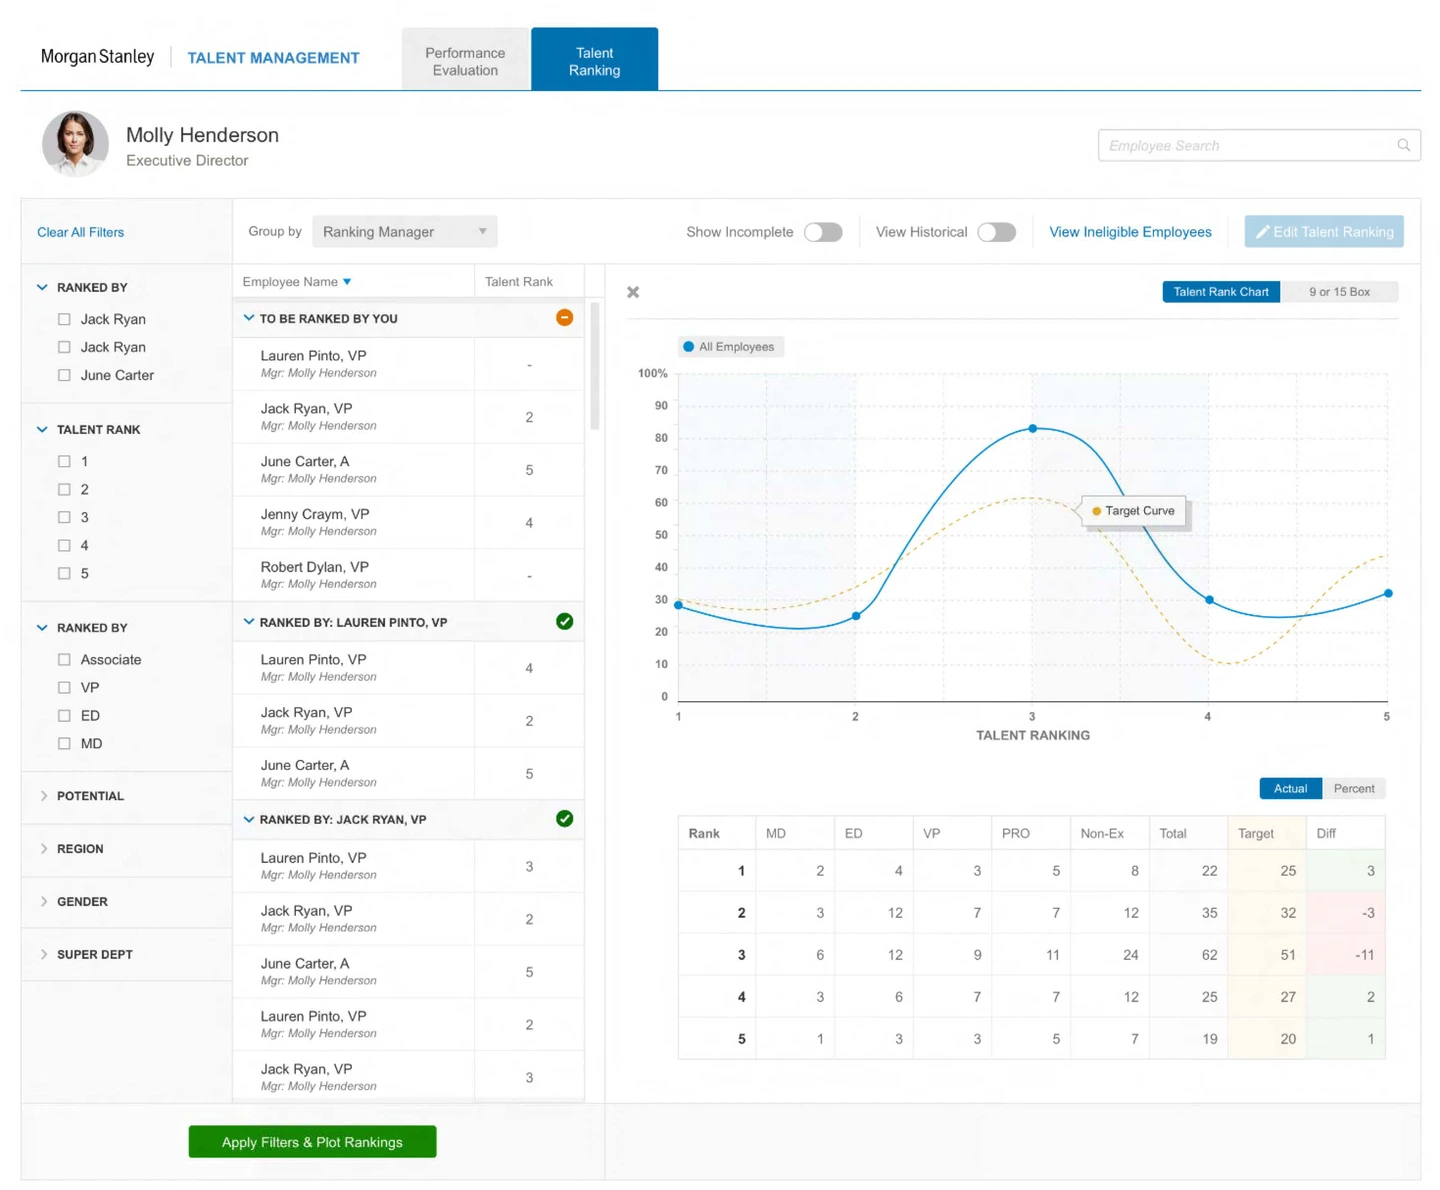
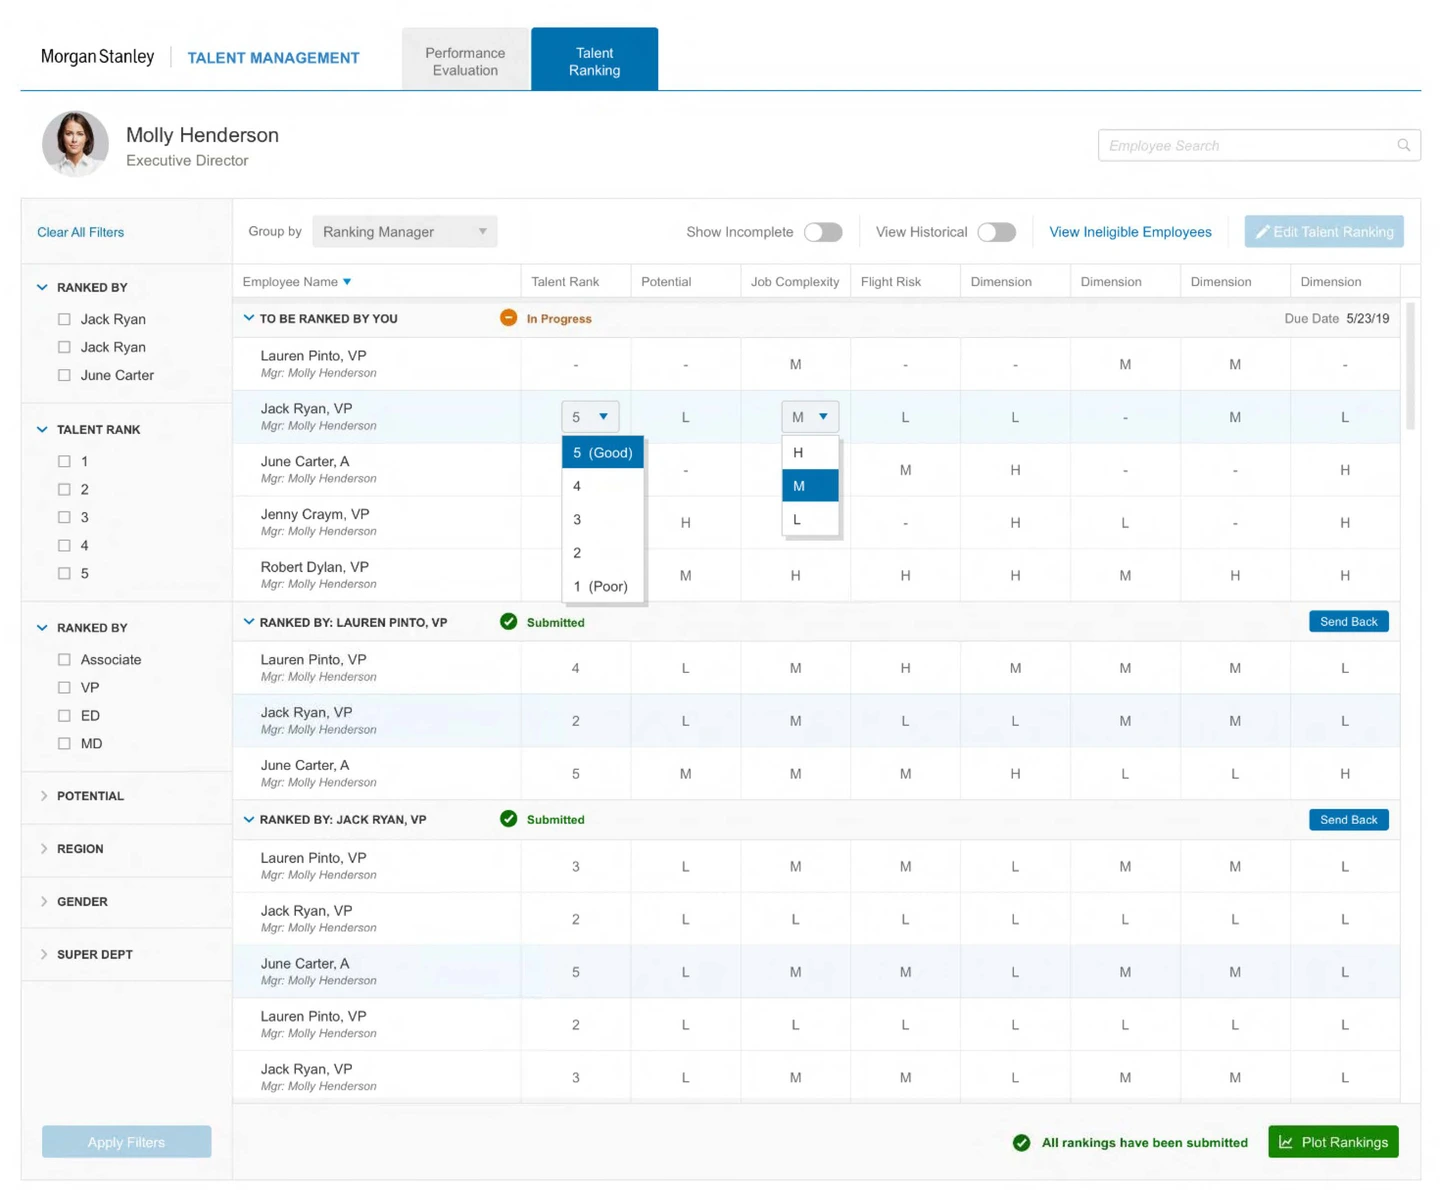
The table combined employee details, editable ranks, and submission status. Managers could identify incomplete work and submitted groups while retaining familiar direct entry.
The talent curve compared employee rankings with the target distribution. Filters, employee details, and totals stayed visible alongside the chart.
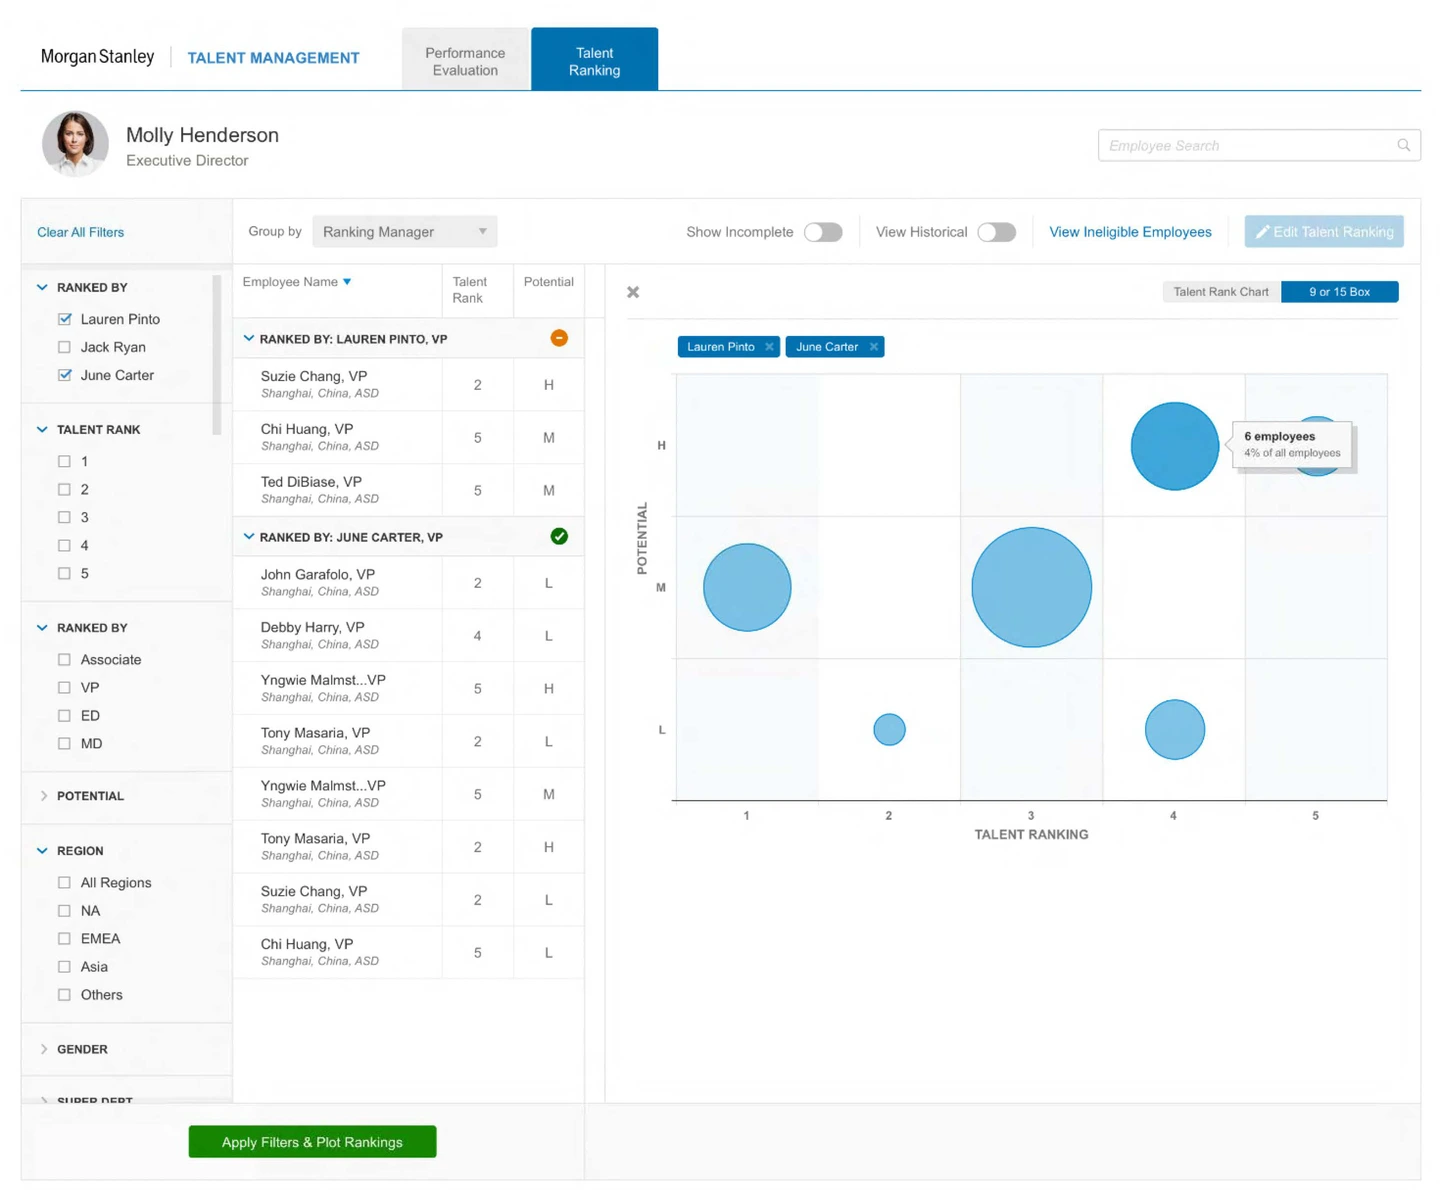
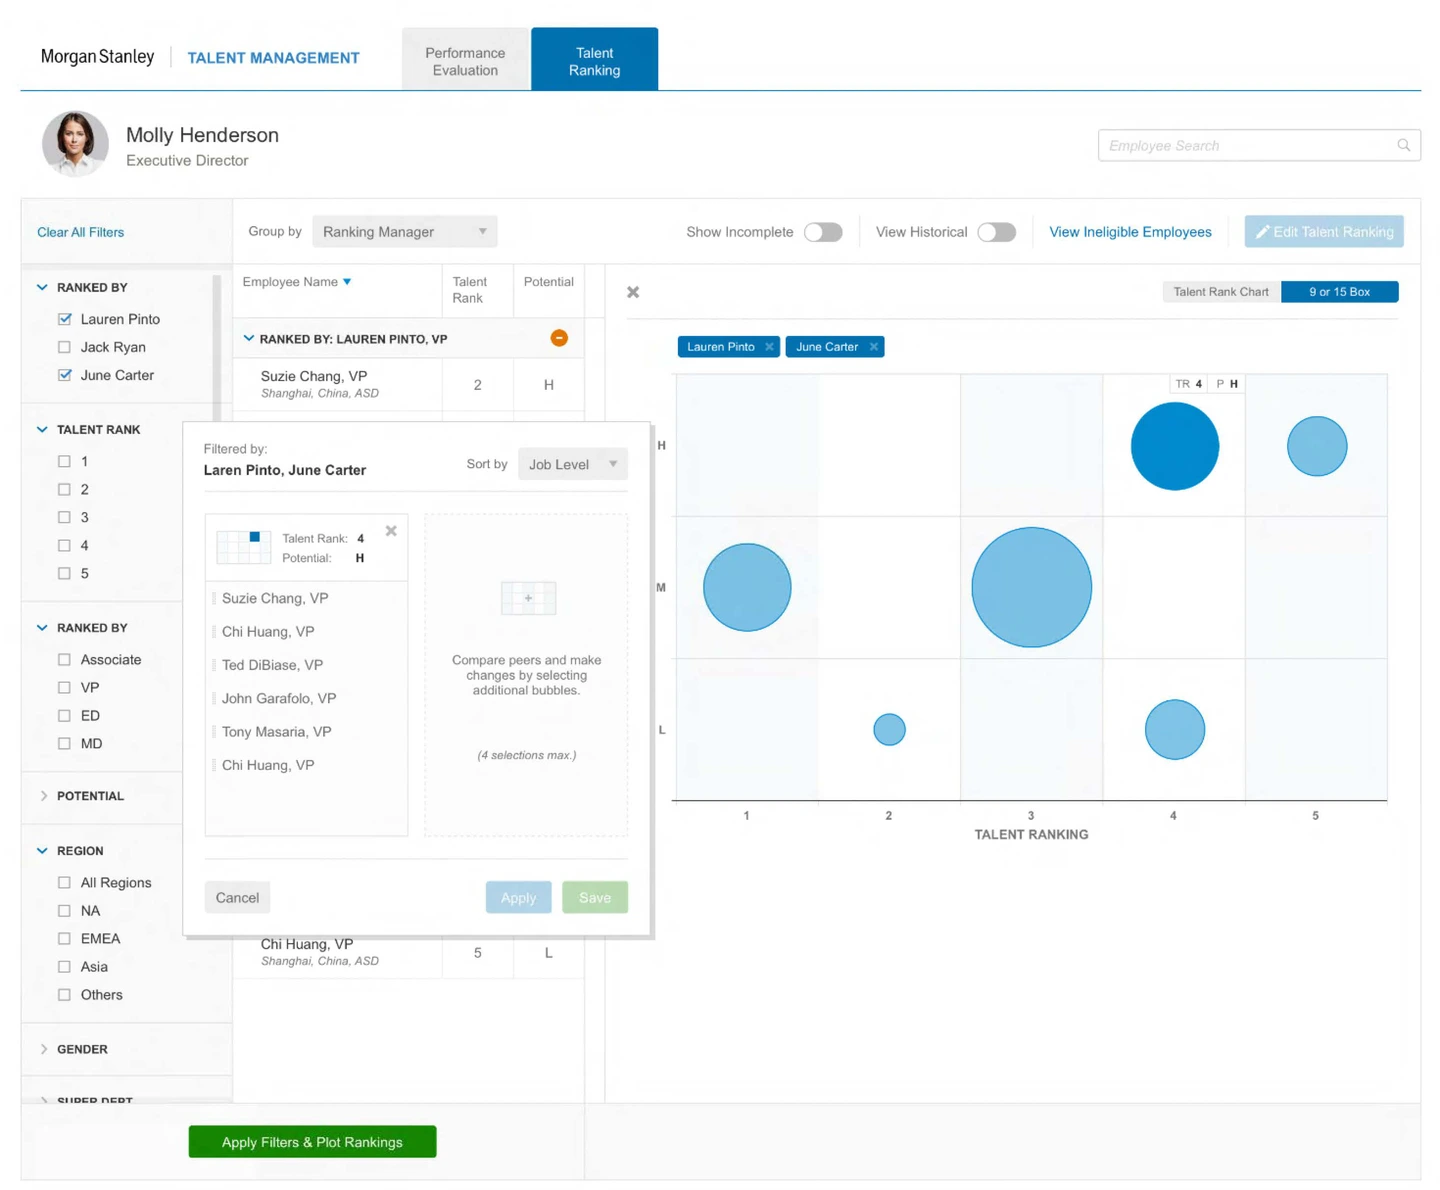
The comparison grid plotted rank and potential. Managers could select groups, compare peers, and edit rankings in the same workspace.
04 / Usability testing
Usability testing and stakeholder interviews indicated faster submission tasks, with positive feedback on the visual approach to ranking.
Direct entry and visual tools supported different ways of working. Familiar controls helped existing users adapt; fewer late submissions remained an anticipated benefit.